Discount Offer Ends in

 TAKE THIS COURSE
Or
TAKE THIS COURSE
Or
- Original price was: £175.00.£21.00Current price is: £21.00.
- 1 year
- Level 5
- Course Certificate
- Number of Units23
- Number of Quizzes0
- 2 hours, 13 minutes Gift this course

Course Curriculum
| Basic Data Analysis | |||
| Introduction | 00:02:00 | ||
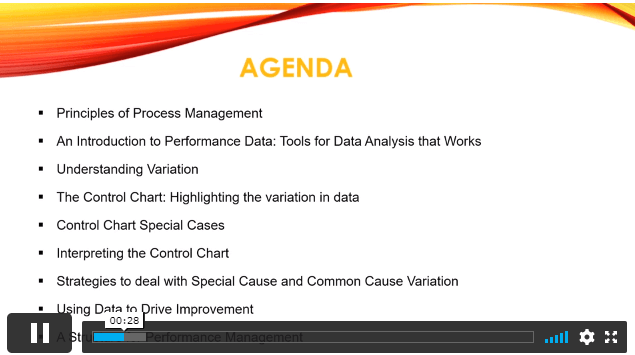
| Agenda and Principles of Process Management | 00:06:00 | ||
| The Voice of the Process | 00:05:00 | ||
| Working as One Team for Improvement | 00:04:00 | ||
| Exercise: The Voice of the Customer | 00:03:00 | ||
| Tools for Data Analysis | 00:07:00 | ||
| The Pareto Chart | 00:03:00 | ||
| The Histogram | 00:03:00 | ||
| The Run Chart | 00:04:00 | ||
| Exercise: Presenting Performance Data | 00:05:00 | ||
| Understanding Variation | 00:06:00 | ||
| The Control Chart | 00:06:00 | ||
| Control Chart Example | 00:04:00 | ||
| Control Chart Special Cases | 00:06:00 | ||
| Interpreting the Control Chart | 00:10:00 | ||
| Control Chart Exercise | 00:07:00 | ||
| Strategies to Deal with Variation | 00:06:00 | ||
| Using Data to Drive Improvement | 00:14:00 | ||
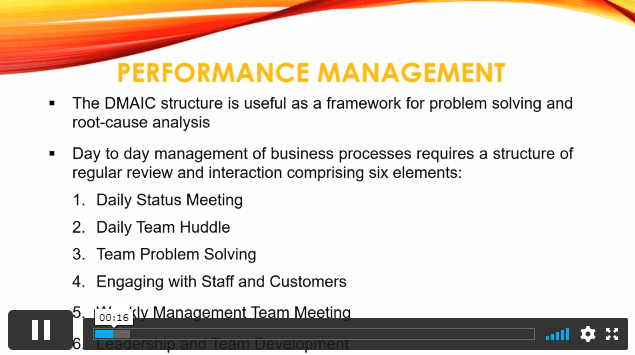
| A Structure for Performance Measurement | 00:06:00 | ||
| Data Analysis Exercise | 00:06:00 | ||
| Course Project | 00:03:00 | ||
| Test your Understanding | 00:17:00 | ||
| Certificate and Transcript | |||
| Order Your Certificates or Transcripts | 00:00:00 | ||
Data Analysis Basics
88% Discount Offer Ends in
Original price was: £175.00.£21.00Current price is: £21.00.
TAKE THIS COURSE
Or
- Original price was: £175.00.£21.00Current price is: £21.00.
- 1 year
- Level 5
- Course Certificate
- Number of Units23
- Number of Quizzes0
- 2 hours, 13 minutes Gift this course
 Gift this course
Share Link on 


Instructors
Buying more than one of the same courses?
- 45% discount for orders of 10+ courses
- 55% discount for orders of 50+ courses
- 65% discount for orders of 100+ courses
Looking for a more personalised package?
contact us now